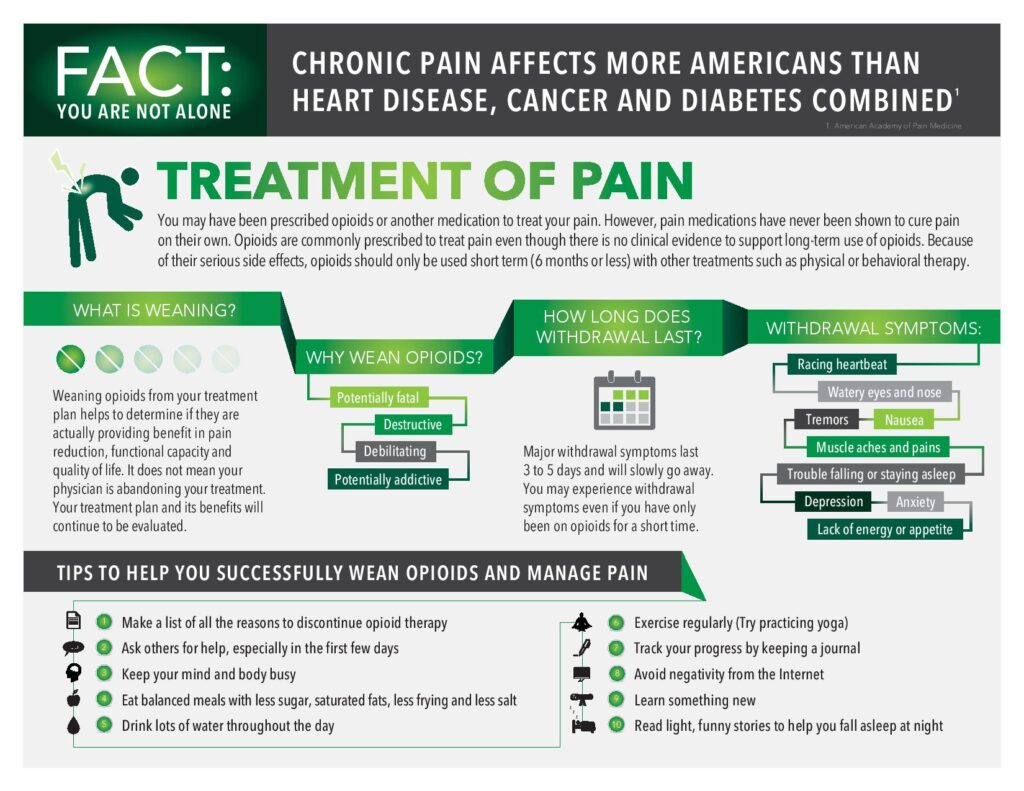
Let’s face it. Infographics are everywhere! There’s been an emergence of infographics on social media, magazine websites and online news sites, just to name a few. With roughly 65% of the population being visual learners, it’s important to cater to that audience as well. If you think your content can’t be represented in an infographic, you might want to reconsider. Here are three ways to transform your content with infographics:
1. Visual Representation. Infographics allow you to show what your content is all about with images and less text. Infographics provide the opportunity for your audience to absorb the information quickly by seeing images that stick. If you are explaining a long list of items or content that can be confusing, infographics can be a great way to show steps or numbered lists. When explaining technical information, it can also be helpful to represent it with visuals in order to organize the information in a way your audience can easily understand. By offering a visual representation, you open up the opportunity to connect with your viewers in a different way than plain text.
2. Less is more. Gone is the need to explain every detail. The beauty of infographics is that your title acts as your blanket subject that all your information is supporting. Instead of having to explain every detail, you can use an image accompanied by brief text to provide necessary details. Infographics allow you to remove the “fluff.” Instead of trying to emphasize certain points with phrases like “most importantly” or “in essence,” using bold, larger font, will help your content stand out to your audience.
3. Repurpose content for various websites. While longer content may work better for LinkedIn, a blog or website, visual content circulates better on Pinterest, Facebook, Twitter and Tumblr. Infographics can increase the chance of your content going viral simply because it is represented visually.
How have you used infographics? Let us know in the comments!

